Improving Production Process of United Tactical Systems (UTS)
During the IEMS Capstone at Northwestern University, my IEMS peers and I collaborated on a project sponsored by United Tactical Systems. Our objective was to enhance their production process and analyze their sampling objectives. This project allowed me to apply the knowledge and skills I had gained throughout my studies in IEMS to a real-world problem. By working on the technical aspects of the project, I was able to demonstrate my mastery of the IEMS tools, techniques, and methodologies, which prepared me for future classes and job opportunities.


Design Process
-
Inefficient data analysis tools
UTS faced a significant challenge in their production process due to the absence of efficient tools for summarizing and analyzing large amounts of data. This limitation prevented UTS from identifying trends and patterns in the machine performance that could help them improve their overall productivity.
Another problem that UTS faces is the lack of a sampling objective and guidelines for shutting down a machine. UTS followed an arbitrary sampling parameters to conduct product testing and decide on machine runtime. This approach is time-consuming, cost-ineffective, and may not provide accurate results. Without clear guidelines for sampling and shutting down machines, UTS is unable to optimize their production processes or ensure that their products meet quality standards.
-
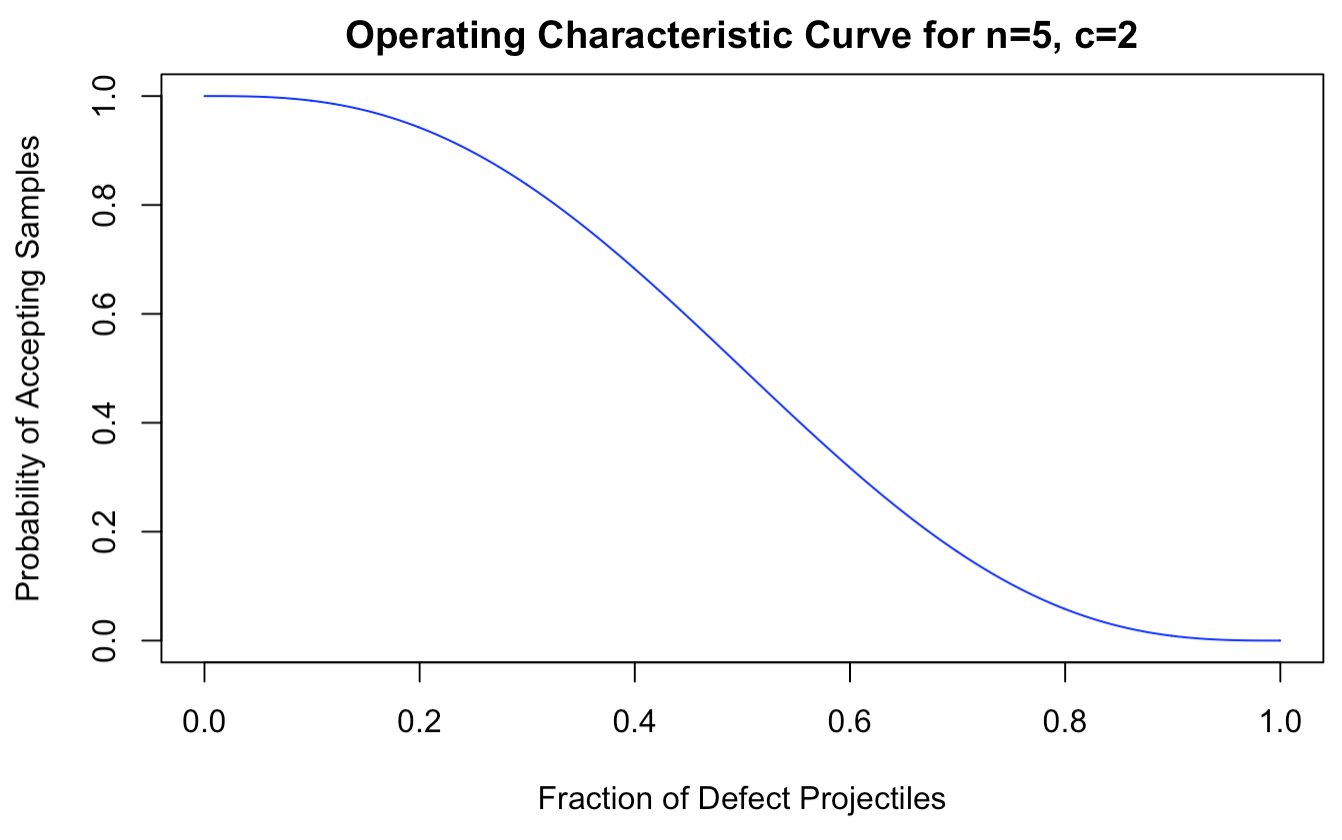
To tackle these challenges, our team utilized Excel Visual Basic for Applications (VBA) to consolidate all daily machine reports into a single, comprehensive spreadsheet. This enabled us to have easy access to all the data in one place. Additionally, we utilized R software programming to develop simulation models. Our goal was to analyze UTS's existing testing plan through operating characteristic curves, with the objective of maximizing machine-specific profit. We also created statistical models to assess quality control, presenting our findings through the use of control charts.
-
After conducting thorough research and leveraging software to better understand UTS's processes, our team developed several tools to help associates visualize their production progress. The first tool is the Excel VBA Master Spreadsheet, which will allow UTS to have all their data stored in a single, easily accessible location, and to easily generate summary statistics.
We also created a control chart template that tracks the hourly defective rate of a machine's production, which UTS can use daily to make informed decisions about machine operation.
Finally, our team assessed the statistical significance of UTS's current sampling process and proposed a new, cost-effective sampling objective that will save UTS money in the long term. This new sampling plan will also be a useful indicator for determining if a machine needs maintenance or downtime.
“It is not knowledge, but the act of learning, not possession but the act of getting there, which grants the greatest enjoyment.” -Carl Friedrich Gauss
Ibrahima Bah
(917) 609-9984
ibrahimabah2023@u.northwestern.edu
